I’m not sure then. If clamconf | grep Concurrent is reporting ConcurrentDatabaseReload as “disabled”, then it should be that way so long as clamd service is restarted per ClamAV’s documentation.
Perhaps freshclam is testing its database?
I’m not sure then. If clamconf | grep Concurrent is reporting ConcurrentDatabaseReload as “disabled”, then it should be that way so long as clamd service is restarted per ClamAV’s documentation.
Perhaps freshclam is testing its database?
Looks like it’s normal for clamd to consume about 2 GB. I upped my VM to 8 GB and after leaving overnight it’s still at ~ 2 GB memory. I think we’re good. Thank you!
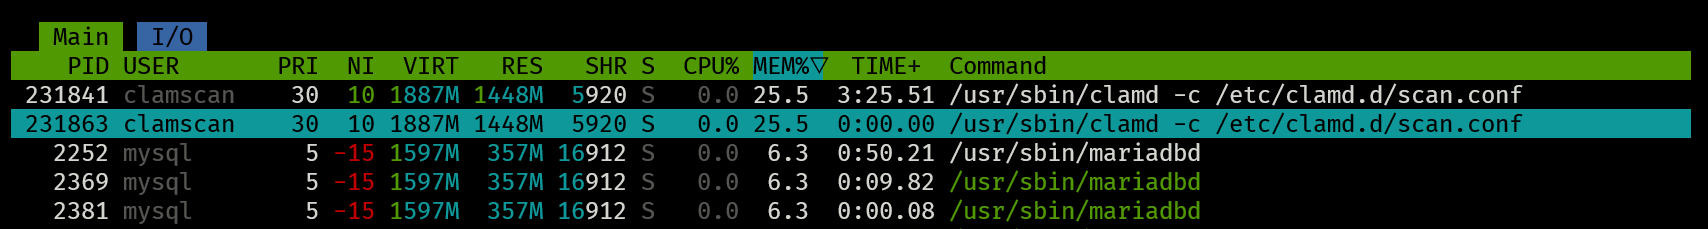
Looking back at the screenshot, it’s confusion arising from htop. In the default view - user threads enabled - threads (TIDs) get mislabeled as independent PIDs.
Those aren’t 2 separate processes but 1 process with 2 threads sharing the same memory segment. Shift + H to hide user threads, which clues you in it’s a single process occupying that chunk of RAM.
versus
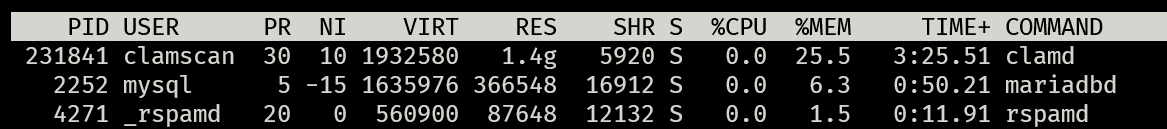
This corresponds to the procfs layout:
# ls -1 /proc/231841/task
231841
231863
Gotcha. Here’s a video showing what happens with Shift+H pressed.