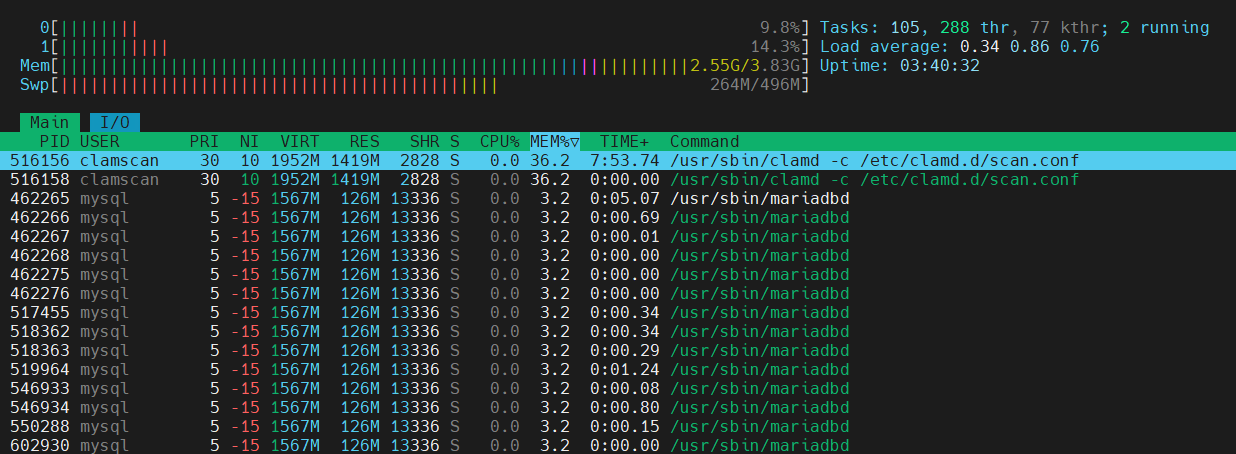
Clamd service has been consuming 1000 mb of RAM and has been consuming more every hour. It was stable initially - below 1000 mb.
From what I read on ApisCP resources, it seems, Clamd only scans new files or changes to existing files. If so, why would the memory consumption increase all of a sudden.
Or does it do scheduled scans? If so, can we configure the scan to happen at later hours when the load on the server is low?
New release of signatures increases the total count of signatures loaded into memory. You can have ClamAV run on demand, which greatly increases scan times from a few hundred milliseconds to several seconds - so at risk of creating a DoS as HTTP requests pile up - this is ill-advised:
# clamscan /bin/bash
/usr/bin/bash: OK

----------- SCAN SUMMARY -----------
Known viruses: 8878529
Engine version: 0.103.11
Scanned directories: 0
Scanned files: 1
Infected files: 0
Data scanned: 0.97 MB
Data read: 0.92 MB (ratio 1.06:1)
Time: 44.231 sec (0 m 44 s)
Start Date: 2023:12:04 08:21:10
End Date:   2023:12:04 08:21:54
versus
# clamdscan /bin/bash
/usr/bin/bash: OK

----------- SCAN SUMMARY -----------
Infected files: 0
Time: 0.771 sec (0 m 0 s)
Start Date: 2023:12:04 08:22:17
End Date:   2023:12:04 08:22:18
If you’d like to disable supplementary signatures, OfficialDatabaseOnly can be set following customization procedure:
Note too, database reloads are concurrent to avoid processing delays. When new signatures are loaded, ClamAV spawns a copy of itself so you may be closer to ~3 GB temporarily. You can see the maximal memory for the process lifetime by looking at memory.max_usage_in_bytes:
If I leave Clamd as it is - as recommended by you, what happens when my systems RAM usage peaks to its max?
Is such a case handled by ApisCP? How does it work, if it does get handled?
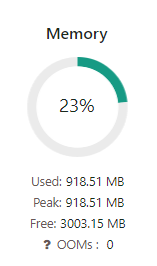
My system has 4000 mb of memory. Currently it runs around 2560 mb usage.
I do understand from another post on the forums, that linux reserves some for cache, which it can release as per need.
OOM killer is invoked only when available memory reaches zero. Kernel is quite judicious on how it spends memory, which is a fairly elastic resource. Free memory is tied up in filesystem caches either on file metadata or data itself to speed up access. Don’t worry about the value of free as reported by free -m. See also linuxatemyram.com
In the event it does happen, then “OOM killer” is invoked. It follows a predictable scoring algorithm in which case clamd will almost certainly be terminated first. If killed, you’ll get an alert through Argos and OOM event logged to dmesg.
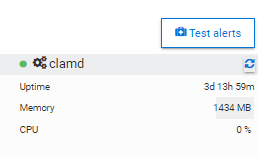
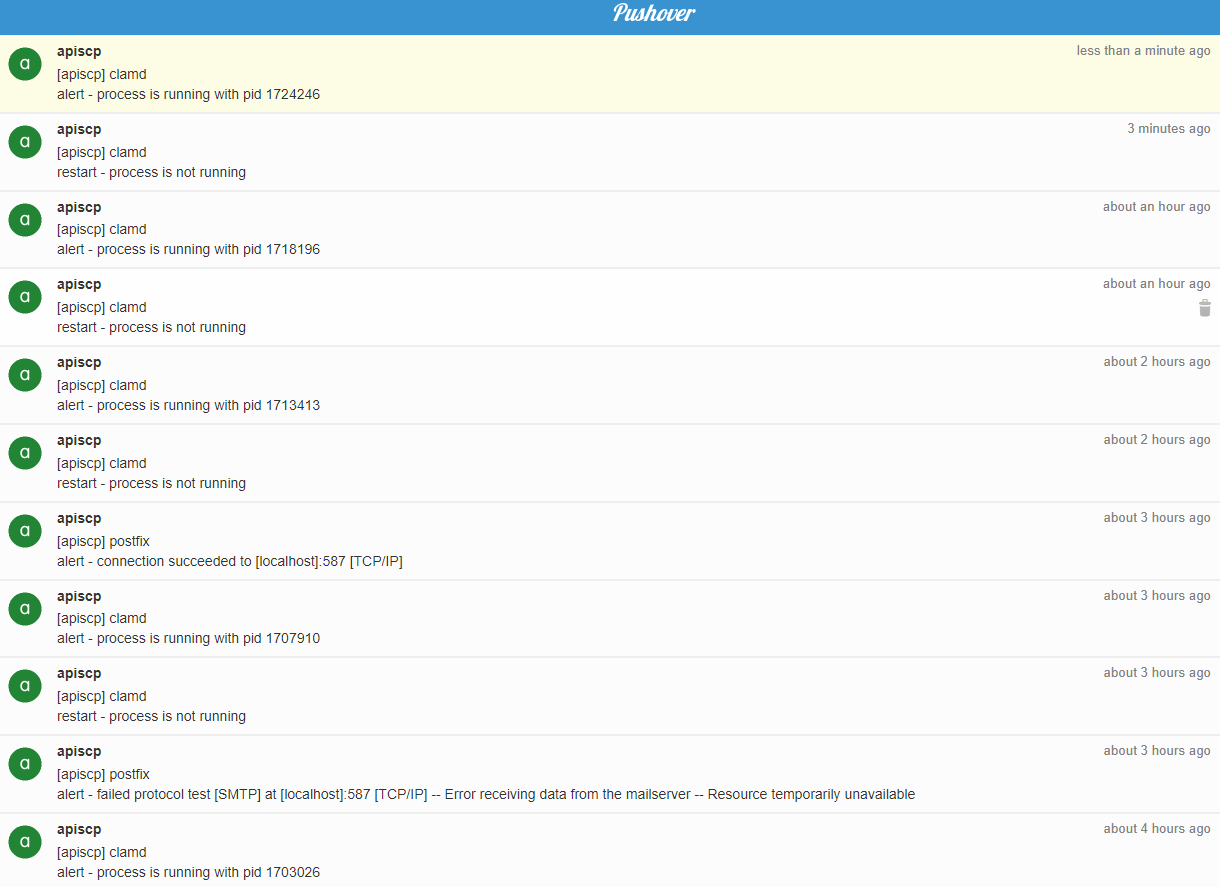
I have a fresh installation of ApisCP and clamd is using 1434 MB. I keep getting alerts that clamd is restarting every hour or so. I only have one site configured right now. Is this a glitch/memory leak?
I will try using official signatures, but I guess the concern is that it’s a fresh installation and still occurring.
ClamAV loads all signatures into memory. Due to natural progression of additional threats, the memory is expected to grow rather than lessen over time. Ideally, this is why delegating scans to a single install works best.
journalctl -n50 -u clamd
-- Logs begin at Mon 2025-02-03 21:18:31 UTC, end at Sun 2025-02-09 22:02:26 UTC. --
-- No entries --
systemctl status clamd
Unit clamd.service could not be found.
Although when checking /var/log/clamav/clamd.log I see this…
Sun Feb  9 20:38:04 2025 -> SelfCheck: Database status OK.
Sun Feb  9 20:48:04 2025 -> SelfCheck: Database status OK.
Sun Feb  9 20:58:04 2025 -> SelfCheck: Database status OK.
Sun Feb  9 21:08:04 2025 -> SelfCheck: Database status OK.
Sun Feb  9 21:18:04 2025 -> SelfCheck: Database modification detected. Forcing reload.
systemctl status clamd@scan is necessary otherwise everything is speculation.
# systemctl status clamd@scan
● clamd@scan.service - clamd scanner (scan) daemon
   Loaded: loaded (/etc/systemd/system/clamd@scan.service; enabled; vendor preset: disabled)
  Drop-In: /etc/systemd/system/clamd@scan.service.d
           └─override.conf
   Active: active (running) since Sat 2025-02-01 02:38:19 EST; 1 weeks 1 days ago
     Docs: man:clamd(8)
           man:clamd.conf(5)
           https://www.clamav.net/documents/
 Main PID: 2706 (clamd)
   CGroup: /system.slice/system-clamd.slice/clamd@scan.service
           └─2706 /usr/sbin/clamd -c /etc/clamd.d/scan.conf
In the abovementioned example we see clamd@scan running for the last week, so we know it’s not restarting. Reloads are perfectly organic, which coincide with freshclam updates.
What does dmesg report? Looks like you’re hitting the memory ceiling of the server and it’s getting an OOM kill. A reload will run 2 parallel copies to retain scanning capabilities while the new copy is loading.
N  9 monit@localhost       Fri Feb  7 16:19  26/799   "monit alert --  Does not exist clamd"
 N 10 monit@localhost       Fri Feb  7 16:21  26/794   "monit alert --  Exists clamd"
 N 11 monit@localhost       Fri Feb  7 18:22  26/799   "monit alert --  Does not exist clamd"
 N 12 monit@localhost       Fri Feb  7 18:25  26/794   "monit alert --  Exists clamd"
 N 13 monit@localhost       Fri Feb  7 19:25  26/799   "monit alert --  Does not exist clamd"
 N 14 monit@localhost       Fri Feb  7 19:28  26/794   "monit alert --  Exists clamd"
 N 15 monit@localhost       Fri Feb  7 20:28  26/799   "monit alert --  Does not exist clamd"
 N 16 monit@localhost       Fri Feb  7 20:30  26/794   "monit alert --  Exists clamd"
 N 17 monit@localhost       Fri Feb  7 21:20  26/799   "monit alert --  Does not exist clamd"
 N 18 monit@localhost       Fri Feb  7 21:23  26/794   "monit alert --  Exists clamd"
 N 19 monit@localhost       Fri Feb  7 22:23  26/799   "monit alert --  Does not exist clamd"
 N 20 monit@localhost       Fri Feb  7 22:26  26/794   "monit alert --  Exists clamd"
 N 21 monit@localhost       Fri Feb  7 23:26  26/799   "monit alert --  Does not exist clamd"
 N 22 monit@localhost       Fri Feb  7 23:29  26/794   "monit alert --  Exists clamd"
 N 23 monit@localhost       Sat Feb  8 00:30  26/799   "monit alert --  Does not exist clamd"
 N 24 monit@localhost       Sat Feb  8 00:33  26/794   "monit alert --  Exists clamd"
 N 25 monit@localhost       Sat Feb  8 00:43  26/799   "monit alert --  Does not exist clamd"
 N 26 monit@localhost       Sat Feb  8 00:45  26/794   "monit alert --  Exists clamd"
 N 27 monit@localhost       Sat Feb  8 01:25  26/799   "monit alert --  Does not exist clamd"
 N 28 monit@localhost       Sat Feb  8 01:28  26/794   "monit alert --  Exists clamd"
 N 29 monit@localhost       Sat Feb  8 02:28  26/799   "monit alert --  Does not exist clamd"
I have a 4 GB dedicated VPS. Only one site at the moment (one user).
The site running is essentially just HTML/JS/CSS and limited PHP. There are no file uploads occurring or user input, so I wouldn’t think clamd would need that much to run? Do I need to tweak a setting?
Can you provide further snippets? There can be OOM from cgroup kills, which are perfectly normal then there can be OOM kills because of pressure on memory management, which is not normal. Context helps understand what we’re looking at rather than speculation.
[515255.453092] oom-kill:constraint=CONSTRAINT_NONE,nodemask=(null),cpuset=user.slice,mems_allowed=0,global_oom,task_memcg=/system.slice/system-clamd.slice/clamd@scan.service,task=clamd,pid=1707910,uid=985
[515255.458961] Out of memory: Killed process 1707910 (clamd) total-vm:3256524kB, anon-rss:2731788kB, file-rss:1924kB, shmem-rss:0kB, UID:985 pgtables:5612kB oom_score_adj:0
[518439.817072] redis-server invoked oom-killer: gfp_mask=0x6200ca(GFP_HIGHUSER_MOVABLE), order=0, oom_score_adj=0
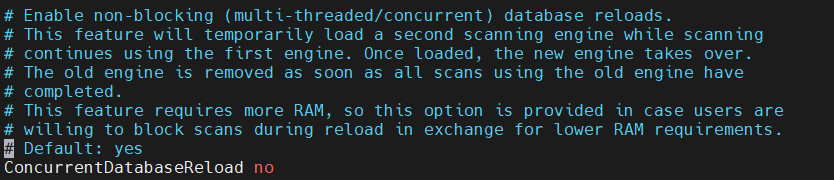
redis-server process requested to allocate more memory, for which there was none available so clamd was killed to satisfy the request. This is due to concurrent reloads that can be disabled by setting ConcurrentDatabaseReload no in /etc/clamd.d/scan.conf:
# Enable non-blocking (multi-threaded/concurrent) database reloads.
# This feature will temporarily load a second scanning engine while scanning
# continues using the first engine. Once loaded, the new engine takes over.
# The old engine is removed as soon as all scans using the old engine have
# completed.
# This feature requires more RAM, so this option is provided in case users are
# willing to block scans during reload in exchange for lower RAM requirements.
# Default: yes
#ConcurrentDatabaseReload no
Make sure ConcurrentDatabaseReload no is defined in /etc/clamd.d/scan.conf, no further ConcurrentDatabaseReload yes is present, and restart the service, systemctl restart clamd@scan