php-fpm core dumping frequently

Description

I’ve been trawling /var/log/messages trying to track down why I can’t upload a 5GB+ tarball via sftp but in the process of doing so discovered some (probably unrelated) core dumping of php-fpm. I’m quite honestly struggling to work out what’s causing this to happen (or indeed why I can’t upload a large file; there are no limits set on the account and sufficient disk space.

User 48 is apache.

Sep  2 03:13:32 apiscp kernel: php-fpm[864936]: segfault at ca70 ip 000000000000ca70 sp 00007ffd6dd09d48 error 14 in php-fpm[400000+d61000]
Sep  2 03:13:32 apiscp kernel: Code: Unable to access opcode bytes at RIP 0xca46.
Sep  2 03:13:32 apiscp systemd[1]: Started Process Core Dump (PID 864972/UID 0).
Sep  2 03:13:35 apiscp systemd-coredump[864973]: Resource limits disable core dumping for process 864936 (php-fpm).
Sep  2 03:13:35 apiscp systemd-coredump[864973]: Process 864936 (php-fpm) of user 48 dumped core.
Sep  2 03:13:35 apiscp systemd[1]: systemd-coredump@74909-864972-0.service: Succeeded.

I can’t say when this started; it’s in all logrotated messages logs. Happens pretty frequently too, perhaps every 5-10 mins, even through the night when there’s not likely to be much in the way of traffic.

Let me know what other information would help to diagnose this please!

Environment

ApisCP version:

revision: 581663bf2e1fec4c02a8b343dd078ce6ed67000e
timestamp: 1756762180
ver_maj: 3
ver_min: 2
ver_patch: 48
ver_pre: 11-g581663bf2
dirty: false
debug: false

Operating System:
4.18.0-553.62.1.el8_10.x86_64 (Rocky)

Additional Information

$ ulimit -c
0

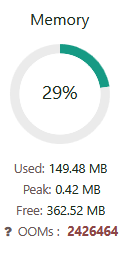
A site I created yesterday indicated 2m+ OOM events!! The coredumps in the logs go back before this site existed so I don’t think it’s directly responsible. (This particular site does have cgroup limits set)
image

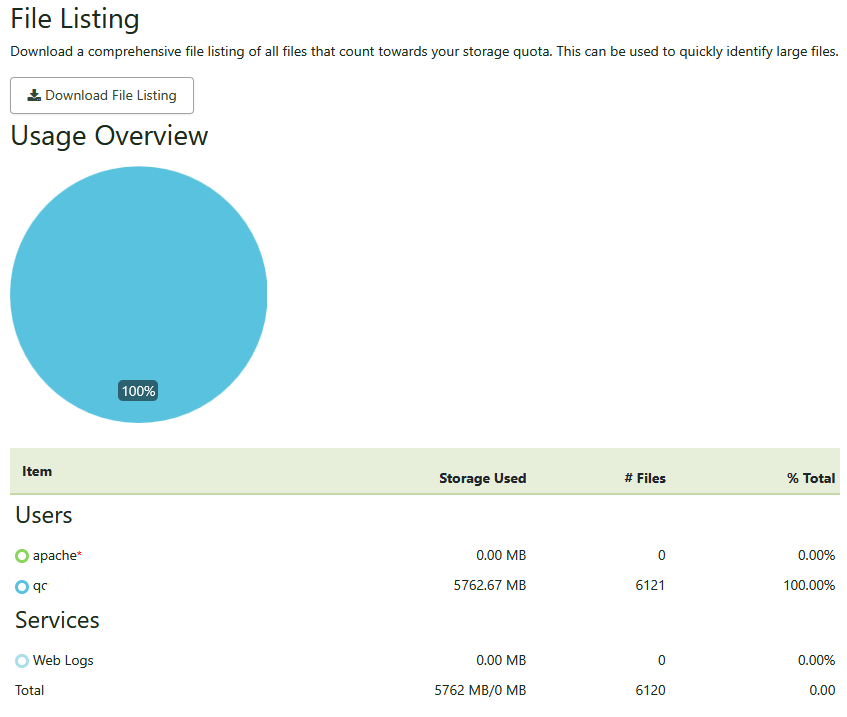
Interestingly (and this just may be a display artefact). Files → Storage Usage reports 100% disk use for sites which have no storage restriction:

Otherwise , sufficient disk space on the server itself:

[root@apiscp log]# df -h
Filesystem                  Size  Used Avail Use% Mounted on
devtmpfs                    7.9G     0  7.9G   0% /dev
tmpfs                       7.9G   24K  7.9G   1% /dev/shm
tmpfs                       7.9G  793M  7.1G  10% /run
tmpfs                       7.9G     0  7.9G   0% /sys/fs/cgroup
/dev/mapper/cs_apiscp-root   70G   18G   53G  26% /
tmpfs                       4.0G  5.0M  4.0G   1% /tmp
/dev/sda1                  1014M  307M  708M  31% /boot
/dev/mapper/cs_apiscp-home   54G   42G   12G  79% /home
tmpfs                       1.6G     0  1.6G   0% /run/user/0
Site is exceeding its combined 512 MB limit for all services (SSH, panel, mail, HTTP, PHP) resulting in an OOM kill. Either increase cgroup,memory for the site or reduce number of PHP processes called “workers” in the PHP policy map.

# Limit PHP-FPM worker count to 5 
cpcmd php::pool-set-policy siteXX workers 5

Filesize is capped at 4 GB to prevent runaway logging from monopolizing storage on a server. You may raise fsize using a Scope:

# Remove this protection
cpcmd scope:set system.process-limits '[fsize: unlimited]'
# Double to 8 GB. Note size is in KB.
cpcmd scope:set system.process-limits '[fsize: 8388608]'

This is very interesting. Noted re file size limits - that, I didn’t know but at least now understand what was happening.

Regarding the OOM; I’m actually surprised at a) the number of OOM events and b) that they’re being triggered at all considering the site in question has been up for less than 24 hours, and that it’s at a URL which is to all intents and purposes unknown (random subdomain for dev purposes). It’s receiving very little traffic if access logs are to be believed. Also doesn’t explain the quantity of OOM errors reported before this particular site went up. I suppose these could be from other sites but there’s otherwise not much happening on this server.

Are cgroup limit transgressions specifically logged, per site anywhere? That would probably help me monitor such events.

Thanks for the guidance, that’s appreciated. It’ll help me track down what’s going on.

I have disabled cgroup for the site with the ridiculous OOM count. There is one other site on the server with cgroup set, and it’s dormant. Yet - I am still getting numerous php-fpm segfaults (700+ in 12 hours) on a box which is basically idle.

Do I have any way of telling which site/service these OOM events relate to? The only php-fpm job that I can see is doing anything in top (and even then, trivial amounts) is for the cp pool.

I do suspect it’s related to the site with high OOM count but I can’t see evidence to support that.

cpcmd -d domain.test telemetry:get c-memory-oom
returns nothing for the suspect domain, and a value of 0 for other domains which have cgroup policies applied.

cpcmd telemetry:range c-memory-oom -86400 null xx
where xx = each site ID also returns either empty string or 0.

So that leaves me wondering what owns the php-fpm process(es) that are getting binned off.

Send help.

PM or email me (matt@apisnetworks.com) the entire log from dmesg, /var/log/boot.log, and coredumpctl list.